Cat Scratch Fever
Mercifully, the graduation party season remains in full swing, while Jeremy Bonderman held the Sox to check swing. Whatever the postmortems may be after games like this, overcoming superior pitching simply doesn't happen with regularity. All of which is why the Tigers remain a force, although the loss of Mike Maroth certainly sets them back. Their staff revolves around power arms with the likes of Bonderman, Zumaya, Rodney, and Verlander, complemented by crafty veterans like Rogers and formerly Maroth.
Tim Wakefield remains in run support purgatory, and we can only hope the sports psychology world has found Matt Clement.
Aside from building a solid staff, the Tigers have built their team to their ballpark. While hitters' parks may be fan friendly, it's easier to attract and retain the essential ingredient, pitching, when the pitchers don't have to cower in fear. Don't expect the Phillies or Rockies to be able to compete with regularity in their bandbox/aerodynamics nightmares. Conversely, the former .406 club seems to have affected the aerodynamics on Fenway, such that it isn't the homer haven it once was.
From About.com "Which parks have the lowest homer rates? Petco Park is the easy one, and it is the worst from both sides of the plate. For lefties, Petco is followed by Kauffman Stadiun (Kansas City), SBC Park (San Francisco), and Fenway Park (Boston). From the right side of the plate, Kauffman and SBC Park are again tough, along with Jacobs Field (Cleveland), Tropicana Field (Tampa), and Shea Stadium (Mets). Fenway Park and Jacobs Field are not generally thought of as tough hitters’ parks, but at least for homers there are significant platoon splits. Also, among the best pitcher’s parks for home runs is Washington’s new home at RFK Stadium. While there is not a full year of data yet, this park is proving to be one of the most difficult home run parks in baseball."
Wikipedia addresses another factor. After the BALCO scandal, MLB put stricter drug testing policies that went into effect in the 2005 season. The statistics also show a similar picture showing the effects of this policy. 2005 was the lowest season since 1997 season in terms of total home runs (5017 in 2005 compared to 4640 in 1997). The average homeruns per game were also lowest since 1997. 2.06 home runs were hit per game in 2005 compared to 2.05 in 1997. 2.06 homeruns per game was considerably smaller than the 2004 season which averaged 2.25 homeruns per game(see [1]). While this difference can be considered as a statistical fluke, it is a big coincidence that can taint the latest records' validity.
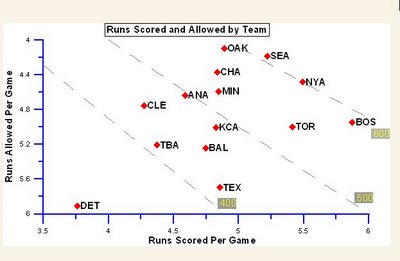
www.baseballgraphs.com shows graphical version of offensive and defensive efficiency, with winning percentage bands. Here in 2003 you can see the Sox production overcame lesser pitching.
________________________________________________
As of today, the Sox are scoring 5.4 runs/game and the Tigers 5.0. The Sox are allowing 4.9 runs a game and the Tigers allowing 3.75. As of today, it's hard for me to argue that the Sox are a better team than the Tigers.
Comments